next-generation PostgreSQL
monitoring tool
Flexible self-contained PostgreSQL metrics monitoring/dashboarding solution

Advantages of PGWATCH
Features
- Non-invasive setup, no extensions or superuser rights required for base functionality
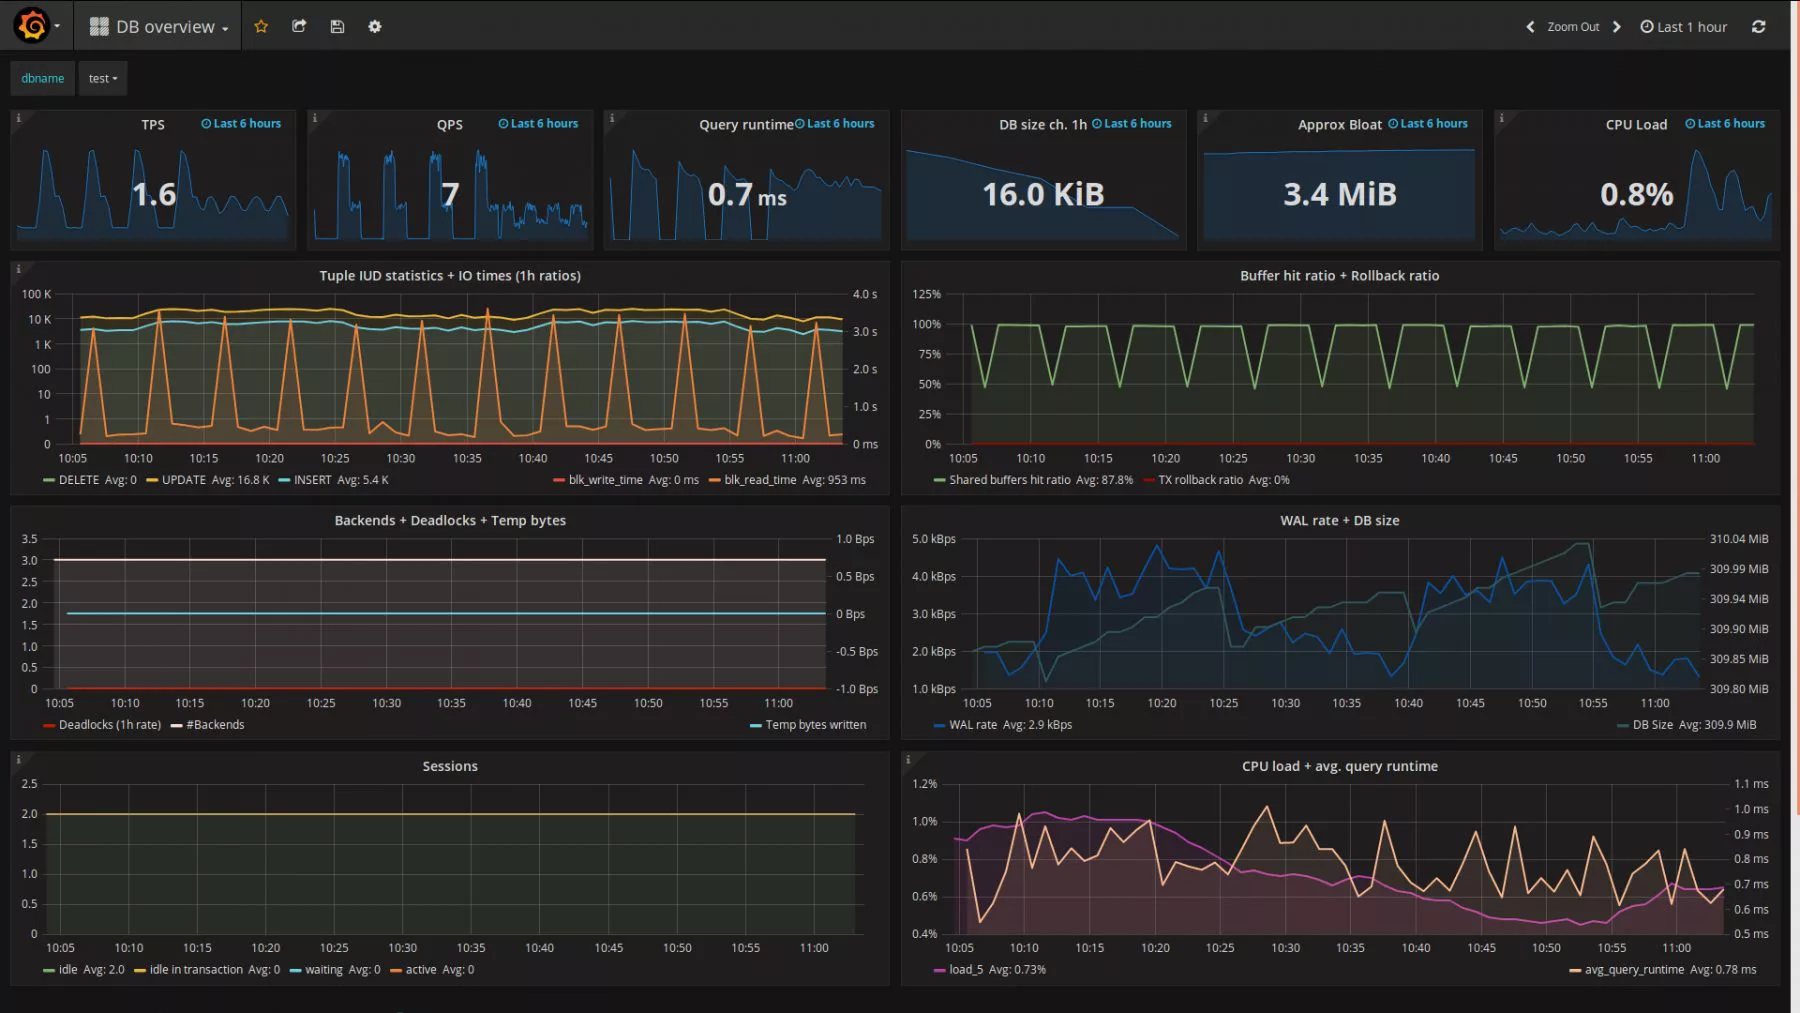
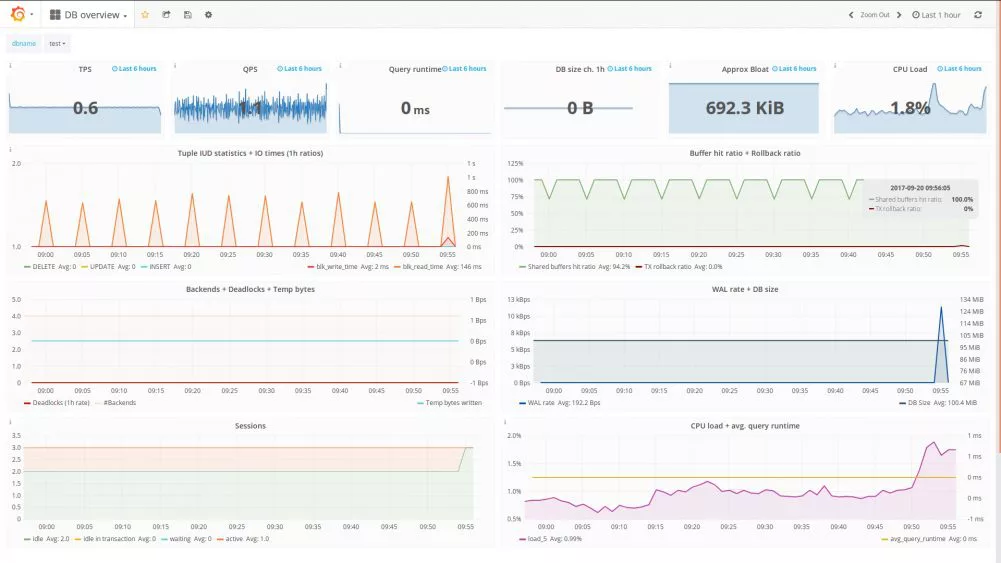
- Intuitive metrics presentation using the Grafana dashboarding engine, with optional Alerting
- Lots of pre-configured dashboards and metric configurations covering all Statics Collector data
- Easy extensibility by defining metrics in pure SQL (which means they can originate from business domain)
- 4 data stores for metrics storage supported (PostgreSQL, InfluxDB, Graphite, Prometheus)
- Multiple configuration options (YAML, PostgreSQL, ENV) supporting both "push" and "pull" models
- Possible to monitoring all or a subset of DBs of a PostgreSQL cluster
- Global or DB level configuration of metrics/intervals
- Server log error monitoring (when installed on DB server)
- Kubernetes/OpenShift ready
- PgBouncer, Pgpool2, AWS RDS and Patroni support
- Internal health-check API to monitor metrics gathering status
- Built-in security with SSL connections and password encryption
- Very low resource requirements for the collector, even when monitoring hundreds of DBs